I’m taking a Social Network Analysis class on Coursera. These weren’t assignments for the class (well, the Facebook one sort of was), just some experiments I wanted to share.
You can use netvizz to download a gdf file of your Facebook network, i.e., all of your Facebook friends and all of the connections between them.
You can then use your favorite graph analysis software (I used Gephi, which is open-source and free) to look for patterns.
My Facebook network is in the image below. Of the four main clusters, two consist of co-workers, one is family and one is people I know from roller hockey.
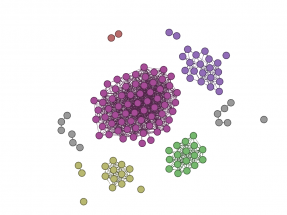
This is the network of people I follow on Twitter. I used NodeXL (a free, open-source template for Excel) to download and lay out the data.
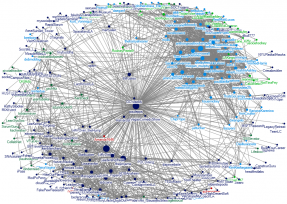
I labeled the nodes in this one. With a few exceptions, the light blue nodes are people I follow because I think they’re funny, the light green nodes are related to sports and/or USC, the dark green nodes are people of professional interest, the red nodes are former colleagues, and the dark blue nodes are everyone else.
The size of the node indicates number of tweets, i.e., larger nodes tweet more than smaller nodes.
My LinkedIn network is a little bigger than my Facebook or Twitter. The green, yellow, blue, purple and orange clusters are co-workers and recruiters. The gray nodes at the top are people with whom I share one or more professional interests. You can see that they split out into multiple sub-groups.
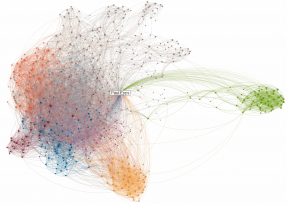
I used the LinkedIn Maps application to generate the graphic.
Summary
These are small-world networks and I had a good idea in advance about who was connected to who and why.
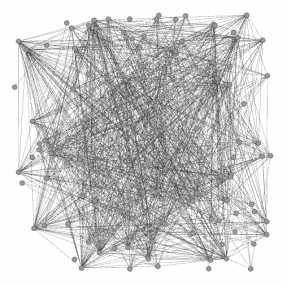
The value of tools like this is in applying them to “real world” networks. In the absence of analytical tools to extract patterns from raw data, large, complex networks just look like giant hairballs.
To give you an idea, this image shows what my Facebook network looks like in Gephi before applying a layout algorithm,
